With the development of new technologies, new uses for complex tracking data are emerging. As part of the hackathon for Austrian Pioneers, we looked at how to work with tracking data and used it to create a virtual, constantly updated, model of the Austrian railways.
Why can tracking the movement of trains be useful?
The locomotives on the Austrian railways are equipped with tracking devices and send GNSS-based data with their position every second.
GNSS refers to satellite positioning technologies of global positioning, which includes the American system GPS, but also the European Galileo or the Russian Glonass.
This data is sent with a slight delay to the railway control room, where it is stored for later use. One possible use is the modeling of a “digital twin” railway line. This can then be compared to a reference railway model to identify where deviations occur to identify where the railway track has been modified that has not yet been reflected in the reference model or to make decisions to improve the quality of the reference model, save costs or improve planning.
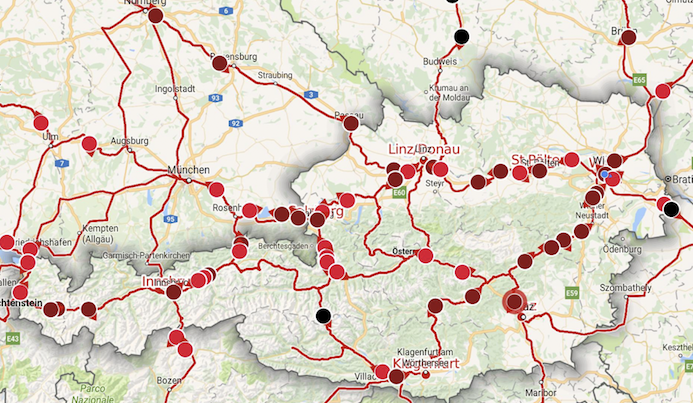
Processing over 100.000 GPS records
Data from GPS trackers contain information about signal quality, this led to us only selecting data that contained positions with high signal quality in the first step of our project. By doing this, we achieved a more reasonable volume of data and started modeling a virtual railway line from GPS coordinates together with a visualization of the provided reference model.
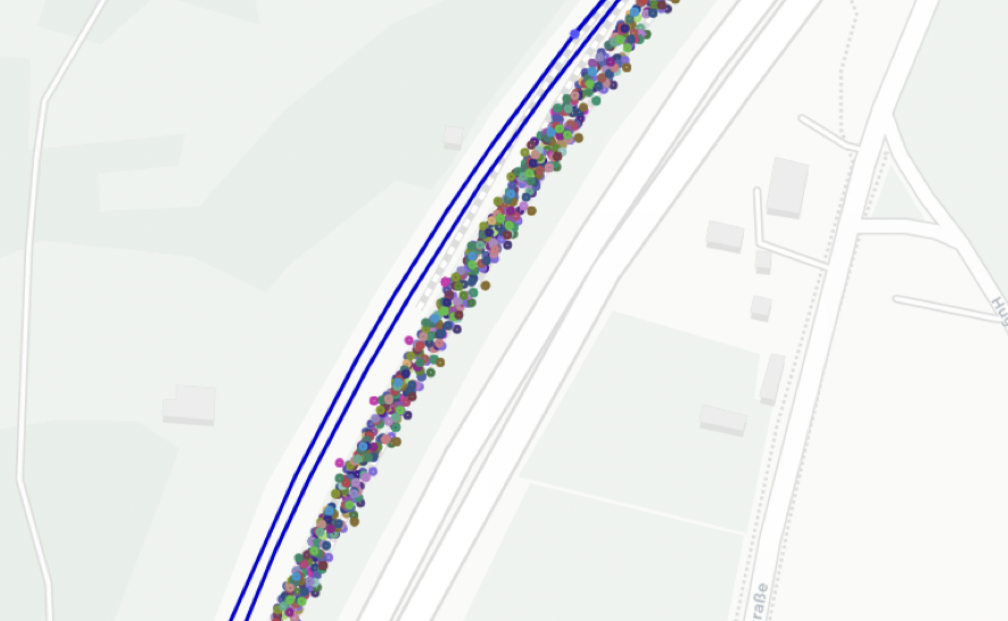
Using a map to detect and visualize the deviations of two tracks
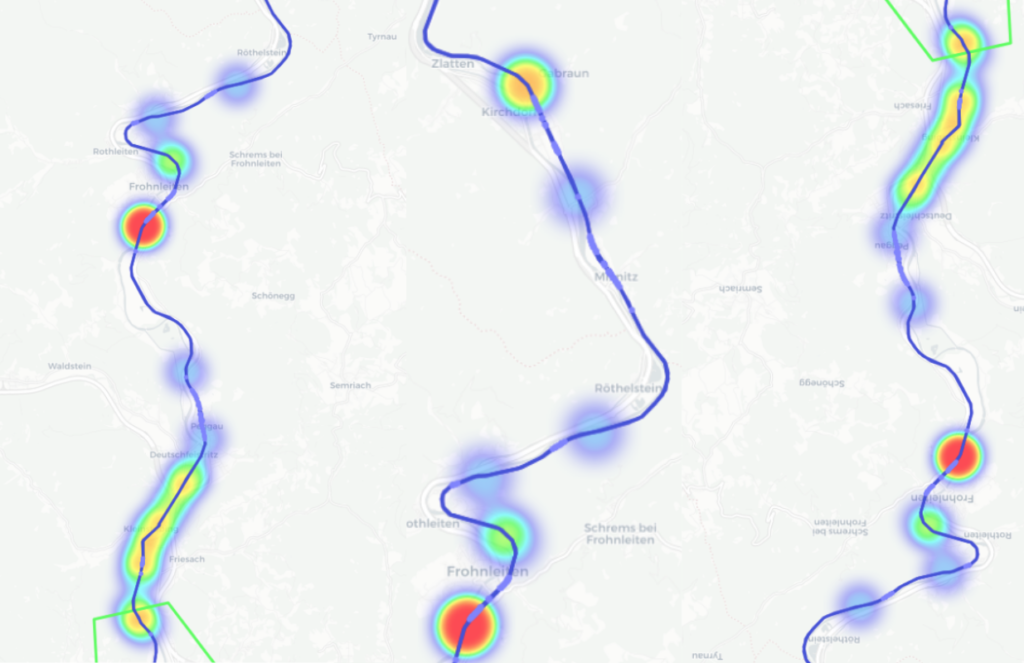
As we were adding more tracking data from a wider time frame and from more trains, significant deviations between the reference model and the tracked data started to appear. Using Geopandas and other tools, we were gradually able to detect the largest deviations and visualize them on a map.
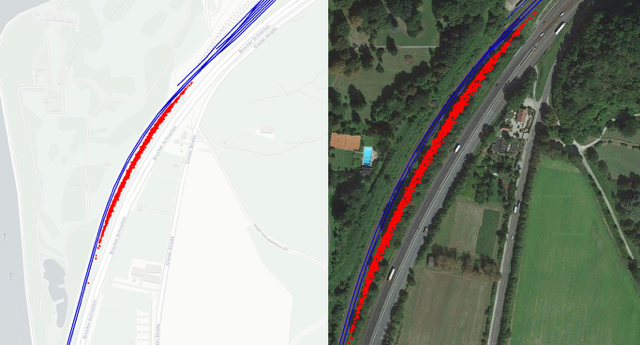
Next, we added additional visuals using a heat map and gradually went through other sections of the railway. We did some interesting discoveries along the way – The picture below visualizes the railway parting into an industrial area.
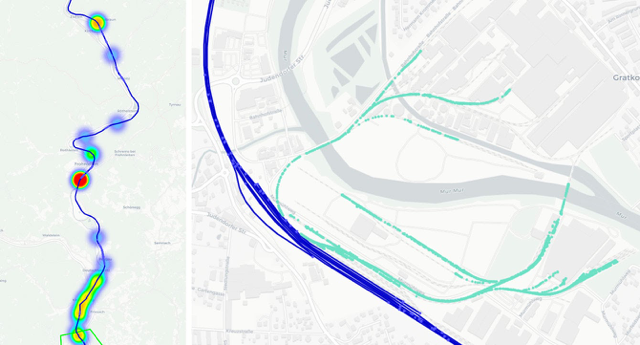
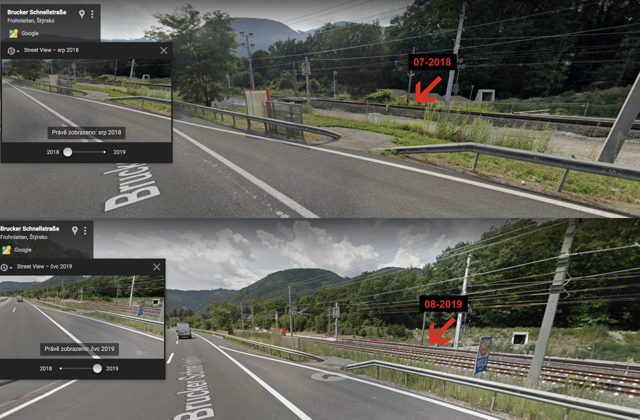
Using the data from an object’s movement
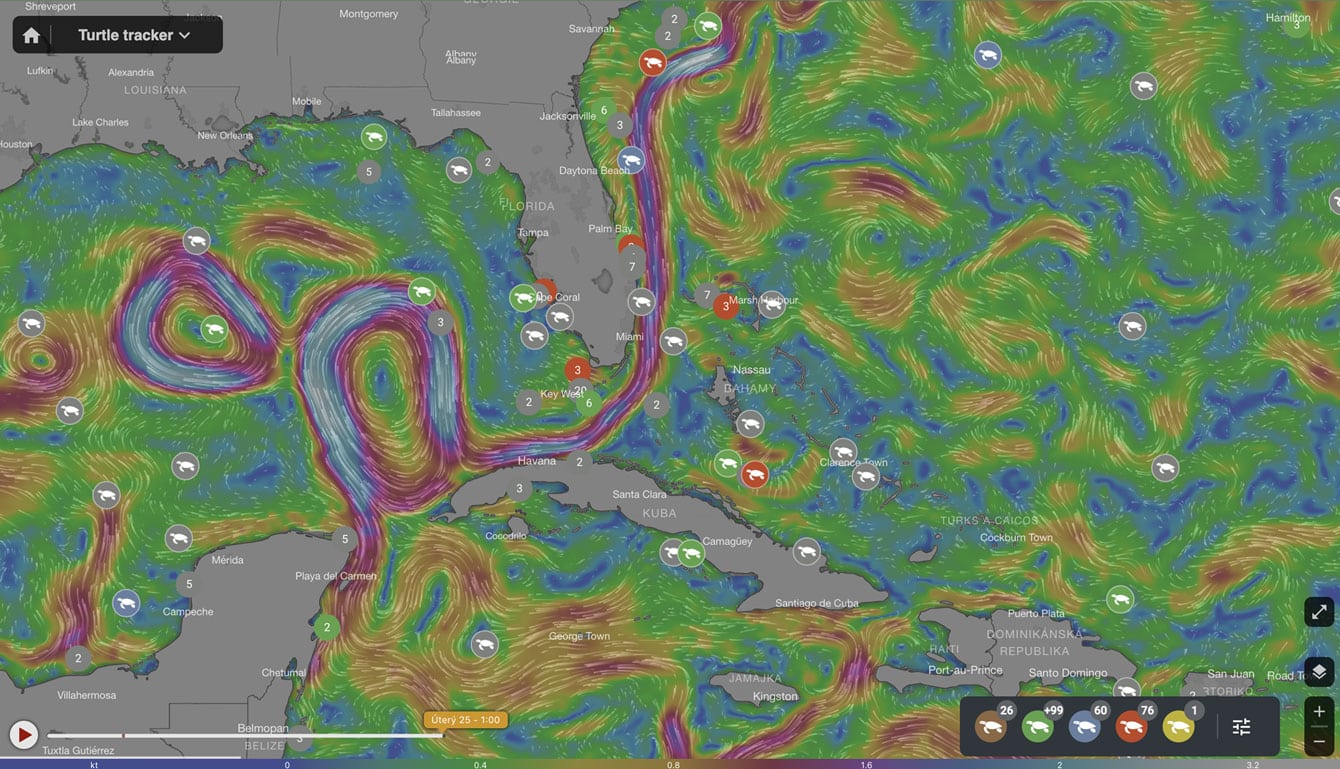
The whole event was a great opportunity for us to test our ability to think about the further development of Mapotic. The detected deviations between the virtual twin and the real railroad track are a great example of how such complex tracking data can be used to plan and improve infrastructure. Similar concept can be seen with our animal tracking solution.
We anticipate for further development of, and work with, both telemetry data and IoT and tracking challenges. We thank the Austrian Pioneers for organizing such a great hackathon and we look forward to future challenges!
If you are looking for a partner for a similar project, do not hesitate to contact us!
