Sea Turtle Conservancy
Sea Turtle Conservancy uses Mapotic to track the movement of sea turtles
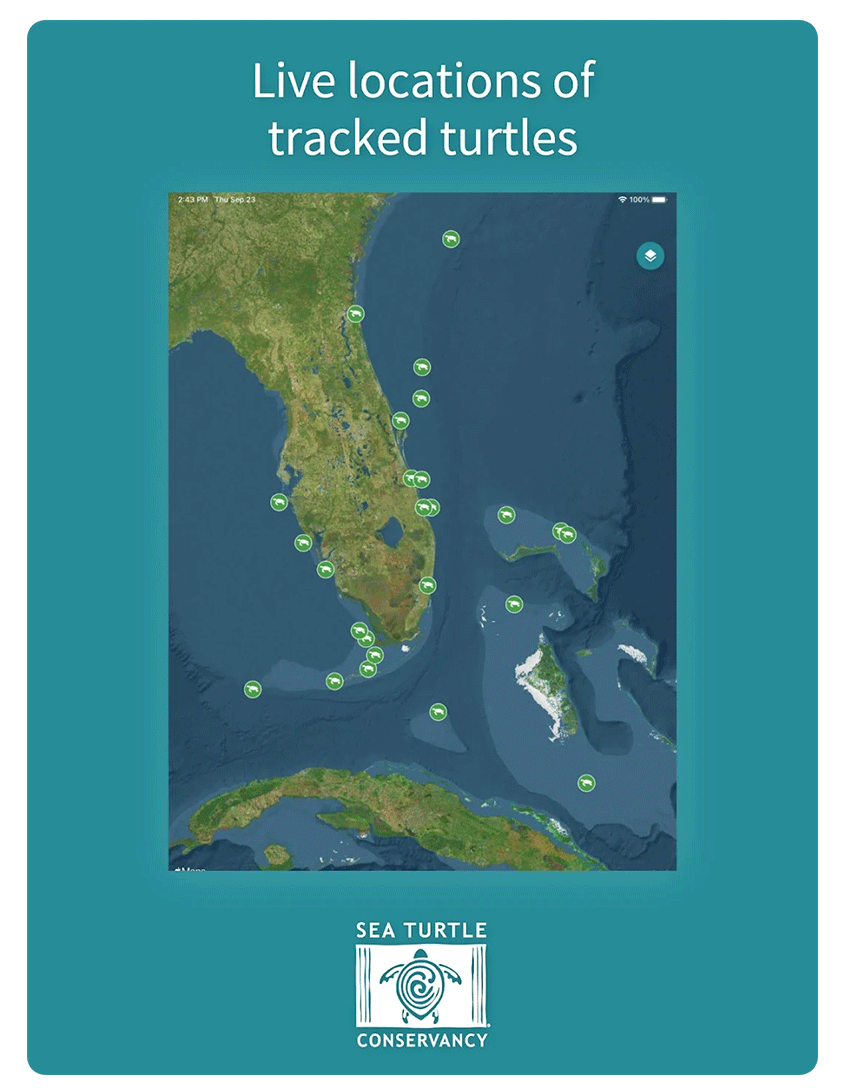
Visualization of sea turtle movement
The world-renowned Sea Turtle Conservancy uses Mapotic to visualize the movement of sea turtles
One of the organization’s key programs is the Sea Turtle Migration Tracking Education Program, in which sea turtles are actively monitored. Mapotic simplified working with the visualization of processed data and enabled easy integration into a web application. We also launched a mobile application for scientists and laymen who are interested in this field. Some positive side-effects were the reduction of costs associated with running map layers and better handling of peaks in traffic.
ABOUT THIS CLIENT
Florida Sea Turtle Conservancy, founded in 1959, is the world’s oldest sea turtle research and conservation organization. The organization deals with education and enlightenment, provides data from its research to many partners, and plays an important part in the global effort for sustainability and preservation of endangered animal species on our planet.
0
+
Active sea turtles
0
+
Turtles in historical database
0
+
Map views per month
Provide data on (near) real-time movement of sea turtles
Monitoring the life of turtles helps us understand climate change better and slow down their extinction
Sea turtles are ancient inhabitants of our planet. Monitoring these fascinating creatures significantly contributes to the entire scientific community’s understanding of the state of our oceans and coastal ecosystems, as well as the changes in the health of our entire planet.
Monitoring movement and migration routes or changes in animal habits is one of the key sources of data for long-term research.
In practice, movement tracking itself takes place when data is sent via satellite to cloud storage from terminal devices (tags that are placed on the turtle’s shell in a sensitive way). In the wilderness where mobile networks are not available, data is sent via satellites (typically Argos).
After that, data in the cloud is processed (GPS quality cleaning) and then connected to the back office or content management system, where the information from the sensors is combined with meta information about each specific turtle.
The challenges we faced while working on the Sea Turtle Conservancy Turtle Tracker project:
Map layers with weather (Windy)
Metric vs. Imperial measurement system
Wordpress API connector
iOS app
Android app
Web embedding and traffic peaks
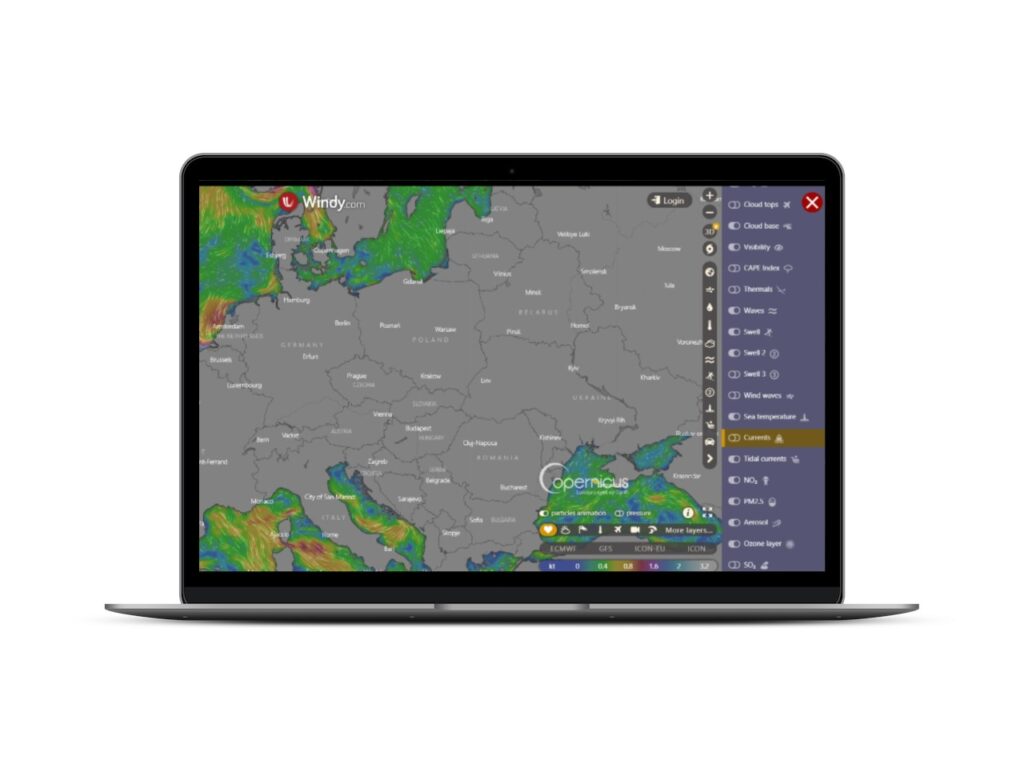
Displaying animal movement in the context of weather
One of the extensions we implemented in the new visualization were map layers showing ocean currents, sea temperature, and air temperature. We used the Czech Windy app that offers the details of the seabed ESRI layers and has one of the best available visualizations of the details of the ocean floor.
The next step will be “time travel”, which allows for the display of the current temperature at the time the data was obtained. Currently, we are preparing a similar function in our platform for other projects as well. It will provide scientists and researchers with a slightly more useful tool for understanding the behavior of rare marine animals.
"Working with Mapotic has been smooth. They helped us reduce the cost of visualizing routes to increase traffic on our website. New web layers and traffic spike management have moved us a little further in our mission of keeping the planet in the best possible condition."
Daniel S., CTO at STC
Easy integration with the existing system
One of the most important aspects of the entire solution is easy integrability. Mapotic can be easily connected to pre-existing systems. By using an API (in this case WordPress), the Mapotic back end regularly downloads tracking data and meta-information, which is then further shared to web outputs or to another API, where the data is taken over by mobile applications.
This easy integration and connectivity enables high flexibility of the entire system. For example, this includes providing data to partners. In the case of STC, it is the Fahlo platform, which connects non-profit organizations with end users and, through the sale of bracelets connected to animal tracking, helps finance the rescue of endangered species. You can read more about Fahlo here.
If you’re interested in other possible uses for dynamic and motion data visualization, check out our other case studies.
Turtle tracker as a mobile app
The Mapotic mobile app is capable of sending data to various platforms and apps, including APIs.
STC already had a mobile application, but its development and maintenance were difficult due to constantly changing technologies. Mapotic came up with a mobile app solution, which now makes it possible to track the movement of animals not only on the map embedded on the web, but also in a separate mobile app for Android and iOS. Mobile apps offer a wide range of advantages, such as the ability to work with user accounts where one can only follow chosen objects, personalize the environment according to their needs, and so on.
Platform uses
Mapotic can be used in various use cases
Static or dynamic data
Processing and aggregation of various location dynamic data
Web or mobile apps
Web versions and branded mobile applications
Public or private
Public portals and customer application or internal systems
Standalone or embedded
Processing and aggregation of various location dynamic data
Full or headless
Turn-key solutions or backend and data processing only
Business or non-profit
Location data and tracking in business or helping the planet